Usage
makeErrorPoly(
  obs,
  sd,
  data,
  outeq = 1,
  col = "red",
  cex = 3,
  pch = "+",
  lcol = "blue",
  lwd = 2,
  ref = T,
  legend = T,
  ...
)
Arguments
- obs
A vector of observations
- sd
A vector of standard deviations obtained from repeated measurements at each observation in
obs- data
A Pmetrics data file. From this, the maximum and mininimum observations will be retrieved. This is useful to ensure that calculated standard deviations are not negative at any observation in the dataset. If not specified, the default is the maximum obs.
- outeq
The output equation in data. Default is 1.
- col
Color of the data points. Default is red.
- cex
Relative size of the data points. Default is 3. See
par.- pch
Ploting symbol. Default is “+”. See
par.- lcol
Color of the fitted polynomial lines. Default is blue.
- lwd
Width of the lines. Default is 2.
- ref
Add a reference line at SD 0 to help evaluate that all fitted SDs are >0. Default is true.
- legend
Boolean argument to plot legend. Default is
TRUE.- ...
Other plotting parameters as in
plot.defaultandpar
Value
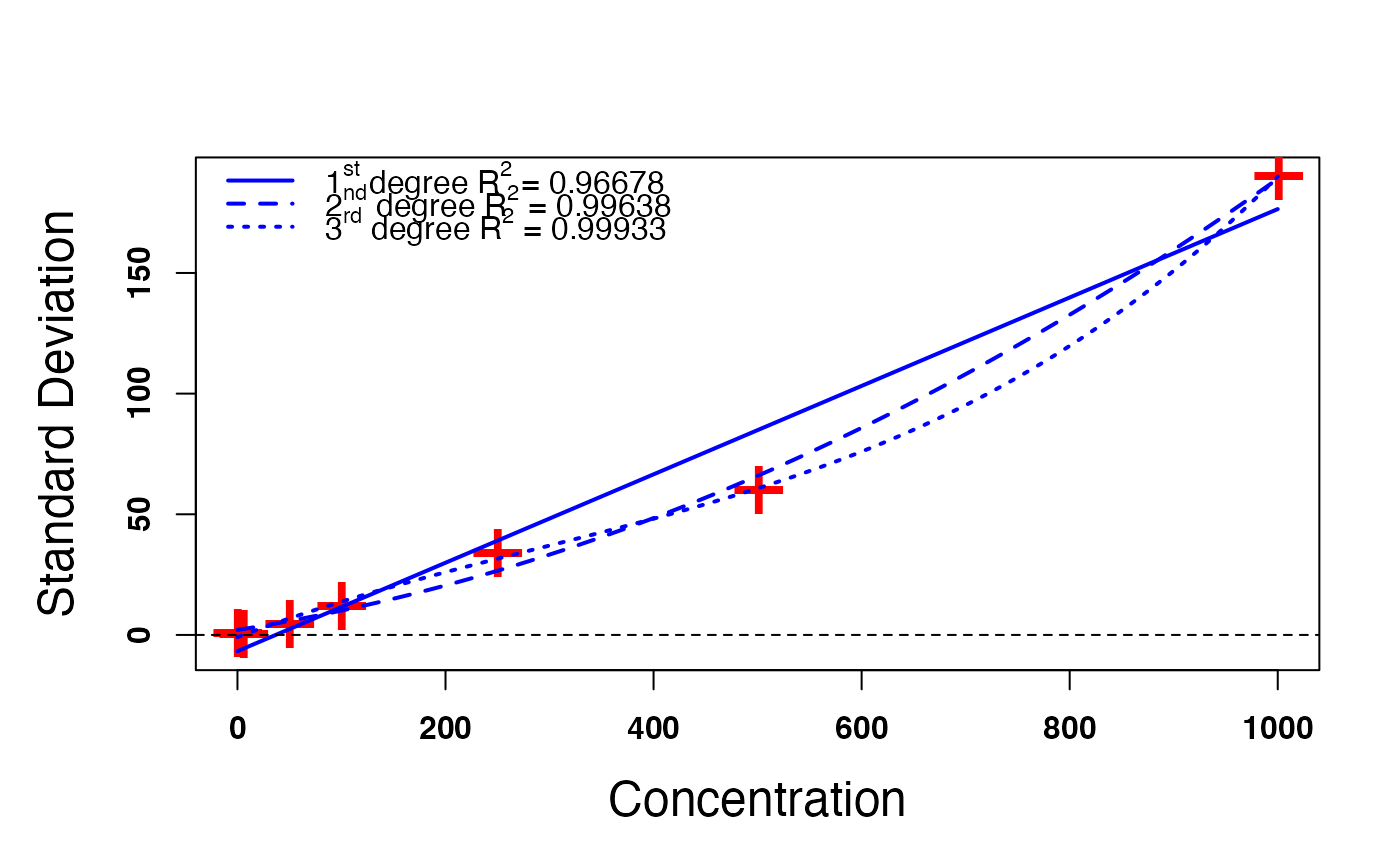
A plot of the measured observations and fitted polynomial curves and a list with the first, second, and third order coefficients
Details
This function plots first, second, and third order polynomial functions fitted to pairs of observations and associated standard deviations for a given output assay. In this way, the standard deviation associated with any observation may be calculated and used to appropriately weight that observation in the model building process. Observations are weighted by the reciprocal of the variance, or squared standard deviation.
